Format a data.frame as flextable::flextable() with Certe style, bold headers and Dutch number formats. This function can also transform existing flextable and gtsummary objects to allow the formatting provided in this tbl_flextable() function.
tbl_flextable(
  x,
  row.names = rownames(x),
  row.names.bold = TRUE,
  rows.italic = NULL,
  rows.bold = NULL,
  rows.height = NULL,
  rows.fill = NULL,
  rows.zebra = TRUE,
  row.total = FALSE,
  row.total.name = "Totaal",
  row.total.function = sum,
  row.total.widths = NULL,
  row.total.bold = TRUE,
  row.extra.header = list(values = NULL, widths = 1),
  row.extra.footer = list(values = NULL, widths = 1),
  column.names = colnames(x),
  column.names.bold = TRUE,
  columns.width = NULL,
  columns.percent = NULL,
  columns.italic = NULL,
  columns.bold = NULL,
  columns.fill = NULL,
  columns.zebra = FALSE,
  column.total = FALSE,
  column.total.name = "Totaal",
  column.total.function = sum,
  column.total.bold = TRUE,
  align = "c",
  align.part = "all",
  caption = "",
  na = "",
  logicals = c("X", ""),
  round.numbers = 2,
  round.percent = 1,
  format.dates = "d mmm yyyy",
  decimal.mark = dec_mark(),
  big.mark = big_mark(),
  font.family = "Source Sans Pro",
  font.size = 9,
  font.size.header = font.size + 1,
  values.colour = NULL,
  values.fill = NULL,
  values.bold = NULL,
  values.italic = NULL,
  autofit = is.null(columns.width) & is.null(rows.height),
  autofit.fullpage = TRUE,
  autofit.fullpage.width = 16,
  vline = NULL,
  vline.part = c("body", "footer"),
  theme = current_markdown_colour(),
  colours = list(rows.fill.even = paste0(theme, "6"), rows.fill.odd = paste0(theme, "5"),
    columns.fill = paste0(theme, "5"), values.fill = paste0(theme, "3"), values.colour =
    theme, vline.colour = theme, hline.colour = theme, header.fill = theme, header.colour
    = "white", vline.header.colour = "white"),
  split.across.pages = NROW(x) > 37,
  print = !interactive(),
  ...
)

# S3 method for class 'certetoolbox_flextable'
print(x, use_knitr = !is_latex_output(), ...)
Arguments
- x
a data.frame or a
flextableobject or agtsummaryobject- row.names
row names to be displayed. Will be
1:nrow(x)if set to TRUE, but can be a vector of values.- row.names.bold
display row names in bold
- rows.italic
column indexes of rows in italics
- rows.bold
column indexes of rows in bold
- rows.height
height of the rows in centimetres
- rows.fill
the column indices of rows to be shaded
- rows.zebra
banded rows in the body - equivalent to
rows.fill = seq(2, nrow(x), 2)- row.total
add a row total (at the bottom of the table)
- row.total.name
name of the row total
- row.total.function
function used to calculate all numeric values per column (non-numeric columns are skipped)
- row.total.widths
cell width in row total
- row.total.bold
bold formatting of row total
- row.extra.header
an extra header to be displayed above the table
an extra footer to show below the table
- column.names
column names to be displayed. Can also be a named vector where the names are existing columns, or indices of columns. When this vector is smaller than
ncol(x), only the firstlength(column.names)are replaced. When this vector is longer thanncol(x), all column names are replaced- column.names.bold
display column names in bold
- columns.width
width of columns. For
autofit.fullpage = TRUE, these are proportions toautofit.fullpage.width. Forautofit.fullpage = FALSE, these are centimeters- columns.percent
display the column indices as percentages using
format2()- example:columns.percent = c(2, 3)- columns.italic
column indices of columns to be displayed in italics
- columns.bold
column indices of columns in bold
- columns.fill
the column indices of rows to be shaded
- columns.zebra
banded columns - equivalent to
columns.fill = seq(2, ncol(x), 2)- column.total
adding a column total (to the right of the table)
- column.total.name
name of the column total
- column.total.function
function used to calculate all numeric values per row
- column.total.bold
bold formatting of column total
- align
default is "c", which aligns everything centrally. Use "r", "l", "c" and "j"/"u" (justify/align) to change alignment. Can be a vector or a character (like "lrrrcc")
- align.part
part of the table where the alignment should take place ("all", "header", "body", "footer")
- caption
table caption
- na
text for missing values
- logicals
vector with two values that replace
TRUEandFALSE- round.numbers
number of decimal places to round up for numbers
- round.percent
number of decimal places to round to when using
columns.percent- format.dates
see
format2()- decimal.mark
decimal separator, defaults to
dec_mark()- big.mark
thousands separator, defaults to
big_mark()- font.family
table font family
- font.size
table font size
- font.size.header
font size of header
- values.colour, values.fill, values.bold, values.italic
values to be formatted
- autofit
format table in width automatically. This will apply
autofit().- autofit.fullpage
display table across width of page
- autofit.fullpage.width
set number of centimetres to width of table
- vline
indices of columns to have a vertical line to their right
- vline.part
part of the table where the vertical lines should be placed ("all", "header", "body", "footer")
- theme
a Certe colour theme, defaults to
current_markdown_colour()which determines the Certe colour based on a markdown YAML header and defaults to"certeblauw". Can also be"certeroze","certegroen", etc. This will set the list incoloursand will be ignored ifcoloursis set manually. Can be set to "white" for a clean look.- colours
a list with the following named character values:
rows.fill.even,rows.fill.odd,columns.fill,values.fill, andvalues.colour. All values will be evaluated withcolourpicker().- split.across.pages
a logical whether tables are allowed to split across page. This argument only has effect for PDF output.
forced printing (required in a
forloop), default isTRUEin non-interactive sessions- ...
not used
- use_knitr
use the
knitrpackage for printing. Ignored when in an interactive session. IfFALSE, an internal certetoolbox function will be used to convert the LaTeXlongtablethat would print across multiple PDF pages. If in a non-interactive session where the output is non-LaTeX, theknitrpackage will always be used.
Value
flextable::flextable object
Details
Run tbl_markdown() on a flextable object to transform it into markdown for use in Quarto or R Markdown reports. If print = TRUE in non-interactive sessions (Quarto or R Markdown), the flextable object will also be printed in markdown.
The value for theme is dependent on whether a colour is set in the markdown YAML header. Otherwise, use theme to set a Certe colour theme, defaults to "certeblauw":
# from the example below
tbl_flextable(df)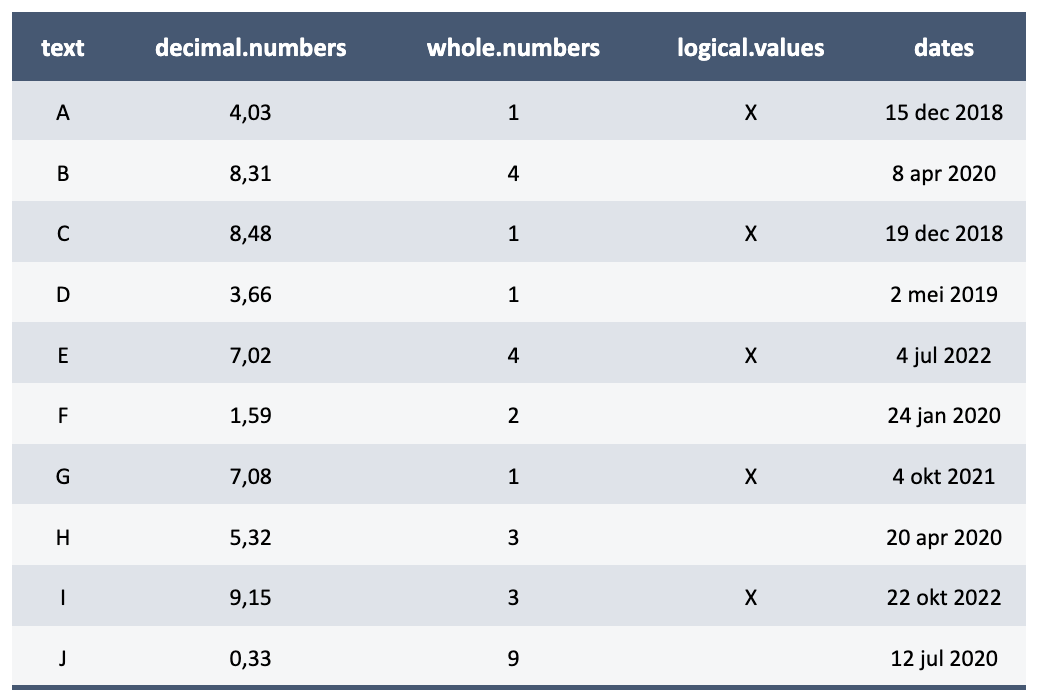
tbl_flextable(df, theme = "certeroze")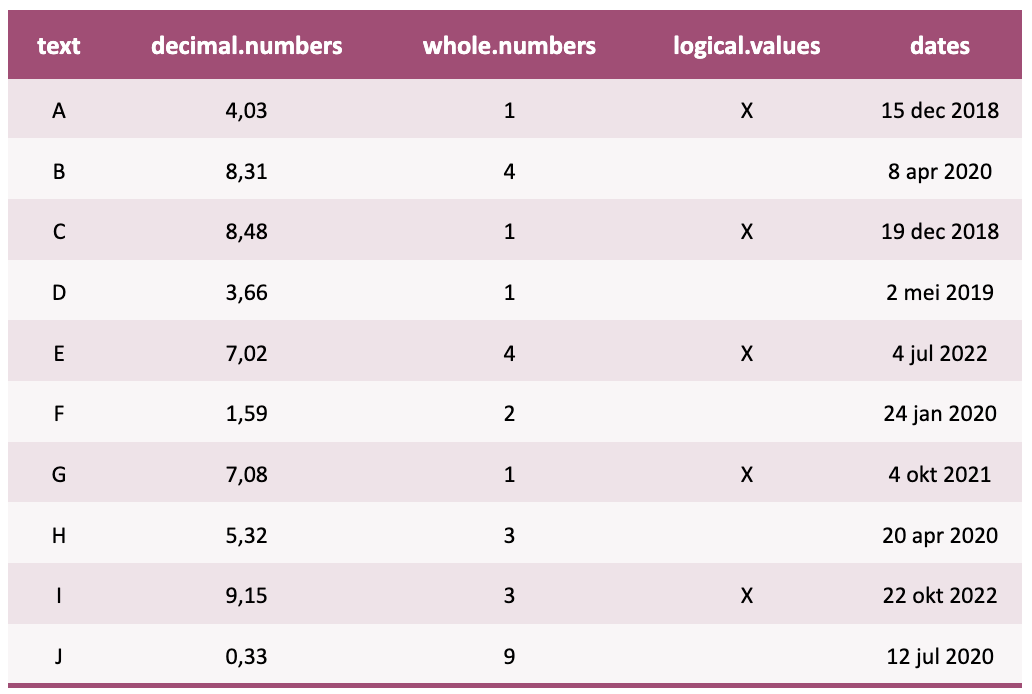
tbl_flextable(df, theme = "certegeel")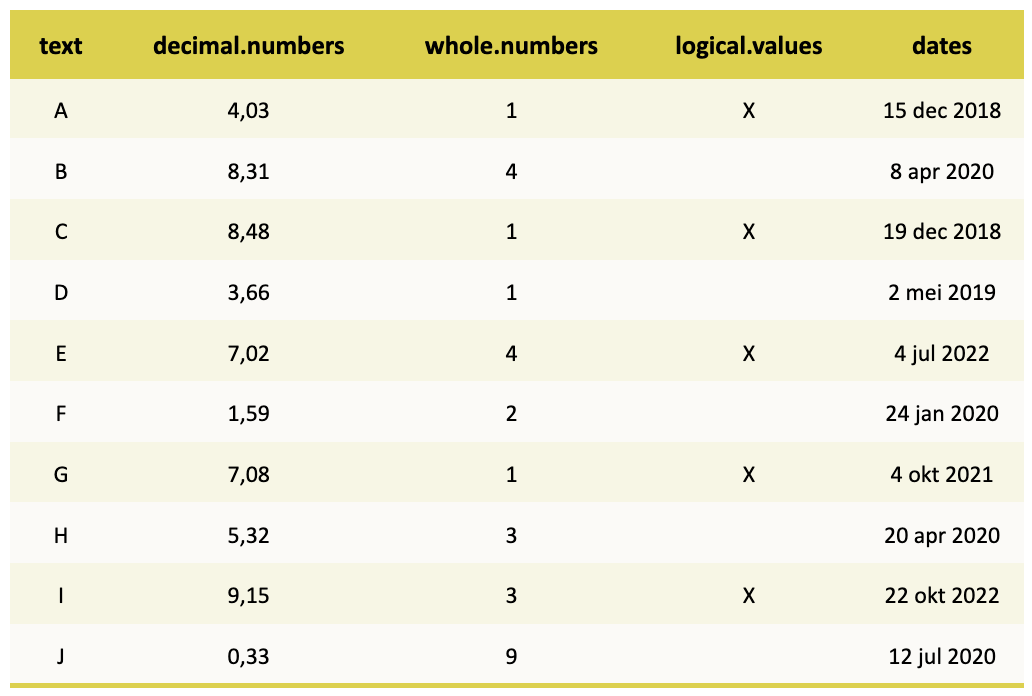
tbl_flextable(df, theme = "certegroen", vline = c(2:3))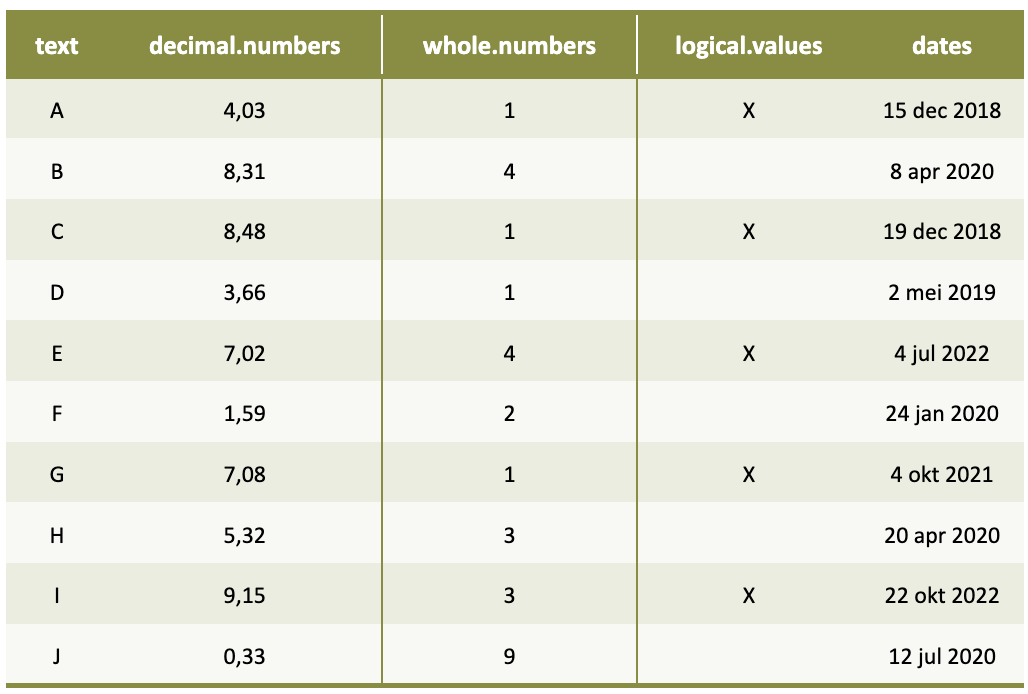
tbl_flextable(
  df,
  theme = "certelila",
  row.total = TRUE,
  row.total.function = median,
  round.numbers = 4,
  row.extra.header = list(values = LETTERS[1:5])
)
See also
Examples
if (FALSE) { # \dontrun{
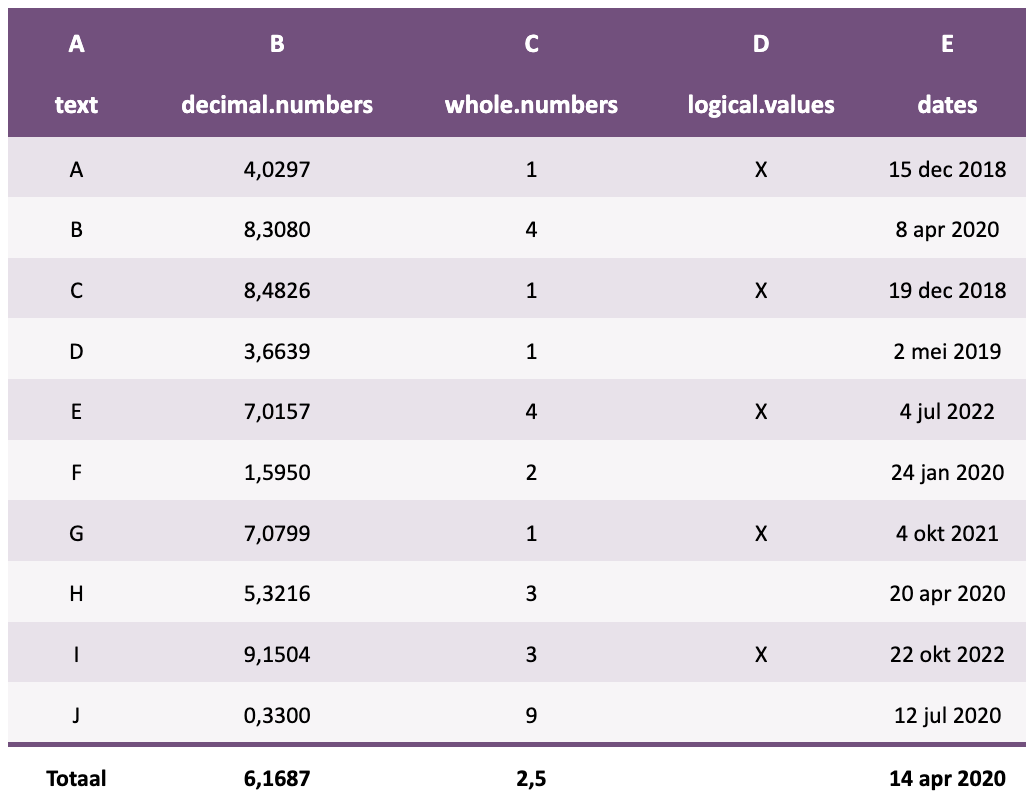
# generate a data.frame
df <- data.frame(text = LETTERS[1:10],
`decimal numbers` = runif(10, 0, 10),
`whole numbers` = as.integer(runif(10, 0, 10)),
`logical values` = as.logical(round(runif(10, 0, 1))),
dates = today() - runif(10, 200, 2000),
stringsAsFactors = FALSE)
# default
tbl_flextable(df) # dataset has no row names
tbl_flextable(mtcars) # dataset has row names
# print in markdown
df |>
tbl_flextable() |>
tbl_markdown()
# transform a gtsummary to a flextable
iris |>
tbl_gtsummary(Species, add_p = TRUE) |>
tbl_flextable()
# extra formatting
tbl_flextable(df,
logicals = c("X", "-"), # replaces TRUE en FALSE
values.colour = "X",
values.fill = "X",
row.names = "S. aureus",
columns.italic = 1,
format.dates = "ddd dd-mm-yy",
round.numbers = 3)
# row totals
tbl_flextable(df,
row.total = TRUE, # add row total
row.total.function = max, # instead of sum()
row.total.name = "Maximum", # also works with dates
columns.percent = 2, # 2nd column as percentages
round.percent = 0) # rounding percentages
# column names
tbl_flextable(df,
column.names = c("1" = "Column 1",
"2" = "Column 2",
dates = "DATES!"))
tbl_flextable(df,
column.names = LETTERS)
# vertical lines, alignment and row names
tbl_flextable(df,
align = "lrrcc", # also works: c("l", "r", "r", "c", "c")
font.size = 12,
vline = c(2, 4),
vline.part = "all",
row.names = paste("Experiment", 1:10))
# width of cells and table
tbl_flextable(data.frame(test1 = "A", test2 = "B"),
vline = 1,
autofit.fullpage.width = 16, # default values in cm
columns.width = c(1, 3)) # ratio; cells become 4 and 12 cm
tbl_flextable(data.frame(test1 = "A", test2 = "B"),
vline = 1,
autofit.fullpage = FALSE, # no fullpage autofit
columns.width = c(1, 3)) # cells become 1 and 3 cm
# adding extra header or footer
tbl_flextable(data.frame(test1 = "A", test2 = "B"),
row.extra.header = list(values = c("Header", "Header"),
widths = c(1, 1)),
row.extra.footer = list(values = c("Footer", "Footer"),
widths = c(1, 1)))
} # }