Formatting with readable format settings and Dutch defaults
format2(x, ...)

# Default S3 method
format2(x, ...)

# S3 method for class 'numeric'
format2(
  x,
  round = ifelse(percent, 1, 2),
  force_decimals = ifelse(percent, TRUE, FALSE),
  decimal.mark = dec_mark(),
  big.mark = big_mark(),
  min_length = 0,
  percent = FALSE,
  ...
)

# S3 method for class 'percentage'
format2(
  x,
  round = 1,
  force_decimals = TRUE,
  decimal.mark = dec_mark(),
  big.mark = big_mark(),
  ...
)

# S3 method for class 'Date'
format2(x, format = "d mmmm yyyy", locale = "nl", ...)

# S3 method for class 'POSIXt'
format2(x, format = "yyyy-mm-dd HH:MM:SS", locale = "nl", ...)

# S3 method for class 'hms'
format2(x, format = "HH:MM:SS", ...)

# S3 method for class 'difftime'
format2(
  x,
  round = 2,
  force_decimals = FALSE,
  decimal.mark = dec_mark(),
  big.mark = big_mark(),
  ...
)

# S3 method for class 'object_size'
format2(x, round = 1, decimal.mark = dec_mark(), ...)

format2_scientific(x, round = 2, decimal.mark = dec_mark(), ...)
Arguments
- x
vector of values
- ...
arguments given to methods such as
format()- round
number of decimals to round to
- force_decimals
force printing decimals, even with trailing zeroes
- decimal.mark, big.mark
decimal and thousands limiters
- min_length
minimal length of output, overwrites
force_decimals- percent
logical to transform numeric to percentage (character)
- format
format to use, can be set with human-readable text such as
"d mmmm yyyy"or POSIX such as"%e %B %Y"- locale
language to set for dates
Value
format2() always returns a character.
Details
Use q/qq/Q/QQ for quartiles, and t/tt/T/TT for four-month periods ('tertaal' in Dutch).
The format2_scientific() function returns an expression and can be used in ggplot2 plots.
Examples
format2("2021-01-01")
#> [1] "1 januari 2021"
format2("2021-01-01", "yyyy-qq")
#> [1] "2021-Q1"
format2("2021-01-01", "yyyy-tt")
#> [1] "2021-T1"
format2(Sys.time(), "d mmmm yyyy HH:MM")
#> [1] "4 april 2026 08:47"
# content-aware of decimal use
format2(1024)
#> [1] "1 024"
format2(c(1024, 0.123))
#> [1] "1 024.00" "0.12"
format2(2.1)
#> [1] "2.1"
format2(2.1, force_decimals = TRUE) # since default is 2 decimals
#> [1] "2.10"
p <- cleaner::as.percentage(0.123)
format2(p)
#> [1] "12.3%"
format2_scientific(c(12345, 12345678))
#> expression("1.23" %*% 10^4, "1.23" %*% 10^7)
format2_scientific(c(12345, 12345678), round = 1)
#> expression("1.2" %*% 10^4, "1.2" %*% 10^7)
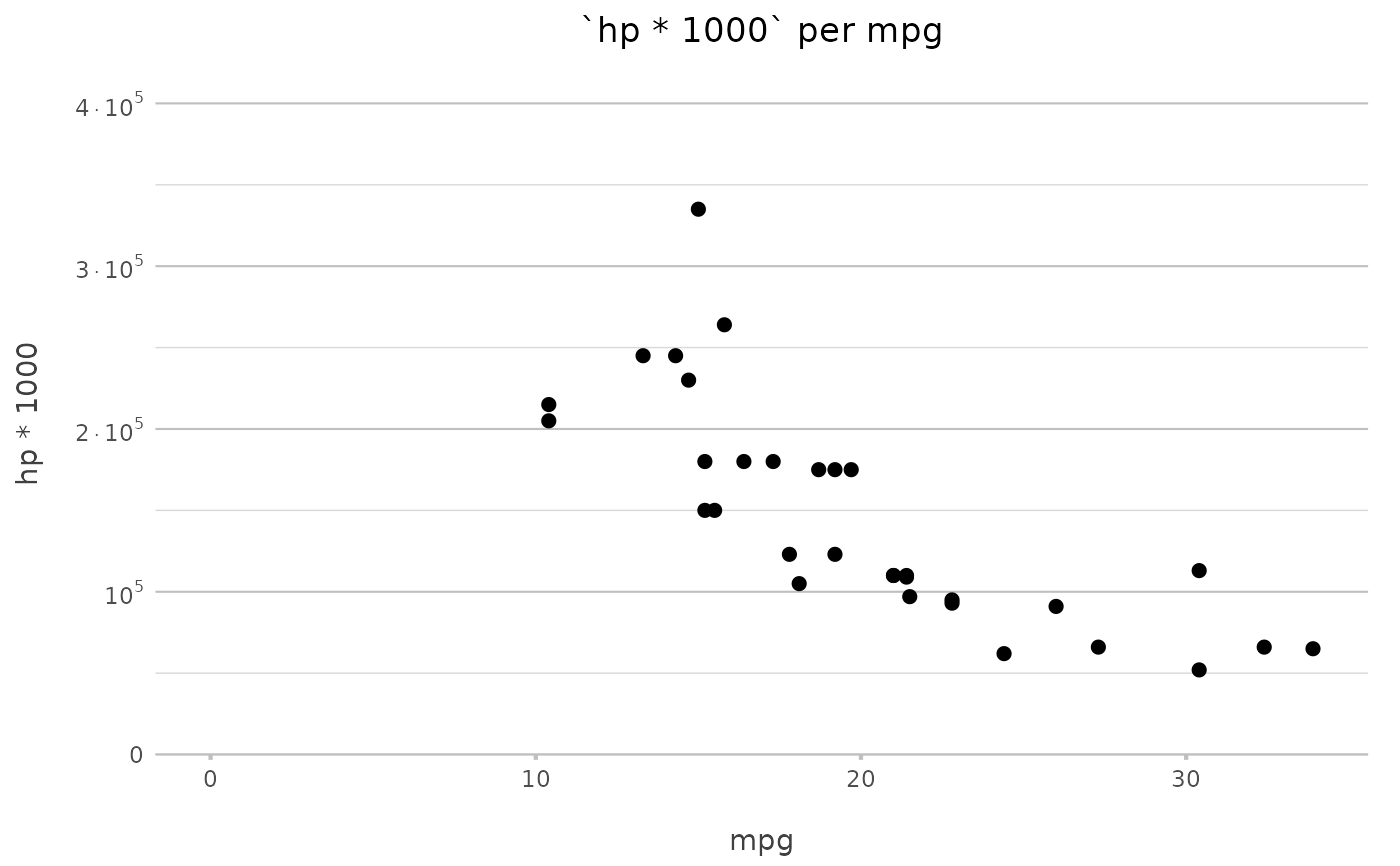
# use format2_scientific for scientific labels in plots:
if (require("certeplot2")) {
# y axis without scientific notation
plot2(mtcars,
y = hp * 1000)
# y axis with scientific notation
plot2(mtcars,
y = hp * 1000,
y.labels = format2_scientific)
}
#> Loading required package: certeplot2
#> Loading required package: plot2
#>
#> Attaching package: ‘plot2’
#> The following objects are masked from ‘package:certestyle’:
#>
#> add_white, big_mark, dec_mark
#> ℹ Downloaded font https://fonts.google.com/specimen/Source+Sans+Pro from Google
#> Fonts
#> ℹ Using type = "point" since both axes are numeric
#> ℹ Using x = mpg
#> ℹ Using type = "point" since both axes are numeric
#> ℹ Using x = mpg