Based on the postcodes4_afstanden data set, this function determines the specified minimum number of cases within a certain radius.
cases_within_radius(
  data,
  radius_km = 10,
  minimum_cases = 10,
  column_count = NULL,
  ...
)
Arguments
- data
data set containing a column 'postcode'
- radius_km
radius in kilometres from each zip code. The search diameter is twice this number (since zip codes e.g. to the west and to the east are searched).
- minimum_cases
minimum number of cases to search for
- column_count
column name in
datawith the number of case counts, defaults to the first column with numeric values- ...
ignored, allows for future extensions
Value
This function adds two columns ("cases_within_radius" <dbl> and "minimum_met" <lgl>) to the input data.
Examples
library(dplyr, warn.conflicts = FALSE)

postcodes_friesland <- geo_postcodes4 |>
  filter_geolocation(provincie == "Friesland") |>
  pull(postcode)

# example with Norovirus cases:
noro <- data.frame(postcode = postcodes_friesland,
                   n = floor(runif(length(postcodes_friesland),
                                   min = 0, max = 3)))
head(noro)
#>   postcode n
#> 1     8388 0
#> 2     8389 0
#> 3     8391 1
#> 4     8392 1
#> 5     8393 0
#> 6     8394 2

radial_check <- cases_within_radius(noro, radius_km = 10, minimum_cases = 10)
#> Using column 'n' for cases_within_radius()
head(radial_check)
#>   postcode n cases_within_radius minimum_met
#> 1     8388 0                  30        TRUE
#> 2     8389 0                  37        TRUE
#> 3     8391 1                  37        TRUE
#> 4     8392 1                  30        TRUE
#> 5     8393 0                  35        TRUE
#> 6     8394 2                  44        TRUE


# dplyr group support:
mdro <- data.frame(type = rep(c("ESBL", "MRSA", "VRE"), 20),
                   pc4 = postcodes_friesland[1:20],
                   n = floor(runif(60, min = 0, max = 3)))
mdro |>
  group_by(type) |>
  cases_within_radius()
#> Using column 'n' for cases_within_radius()
#> Analysing cases for group 1 out of 3 (n = 20)...
#> OK.
#> Analysing cases for group 2 out of 3 (n = 20)...
#> OK.
#> Analysing cases for group 3 out of 3 (n = 20)...
#> OK.
#> # A tibble: 60 × 5
#> # Groups:   type [3]
#>    type    pc4     n cases_within_radius minimum_met
#>    <chr> <dbl> <dbl>               <dbl> <lgl>
#>  1 ESBL   8388     0                  14 TRUE
#>  2 MRSA   8389     1                  16 TRUE
#>  3 VRE    8391     0                   5 FALSE
#>  4 ESBL   8392     2                  12 TRUE
#>  5 MRSA   8393     2                  15 TRUE
#>  6 VRE    8394     0                   5 FALSE
#>  7 ESBL   8395     2                  13 TRUE
#>  8 MRSA   8396     0                  11 TRUE
#>  9 VRE    8397     2                   3 FALSE
#> 10 ESBL   8398     1                   7 FALSE
#> # ℹ 50 more rows


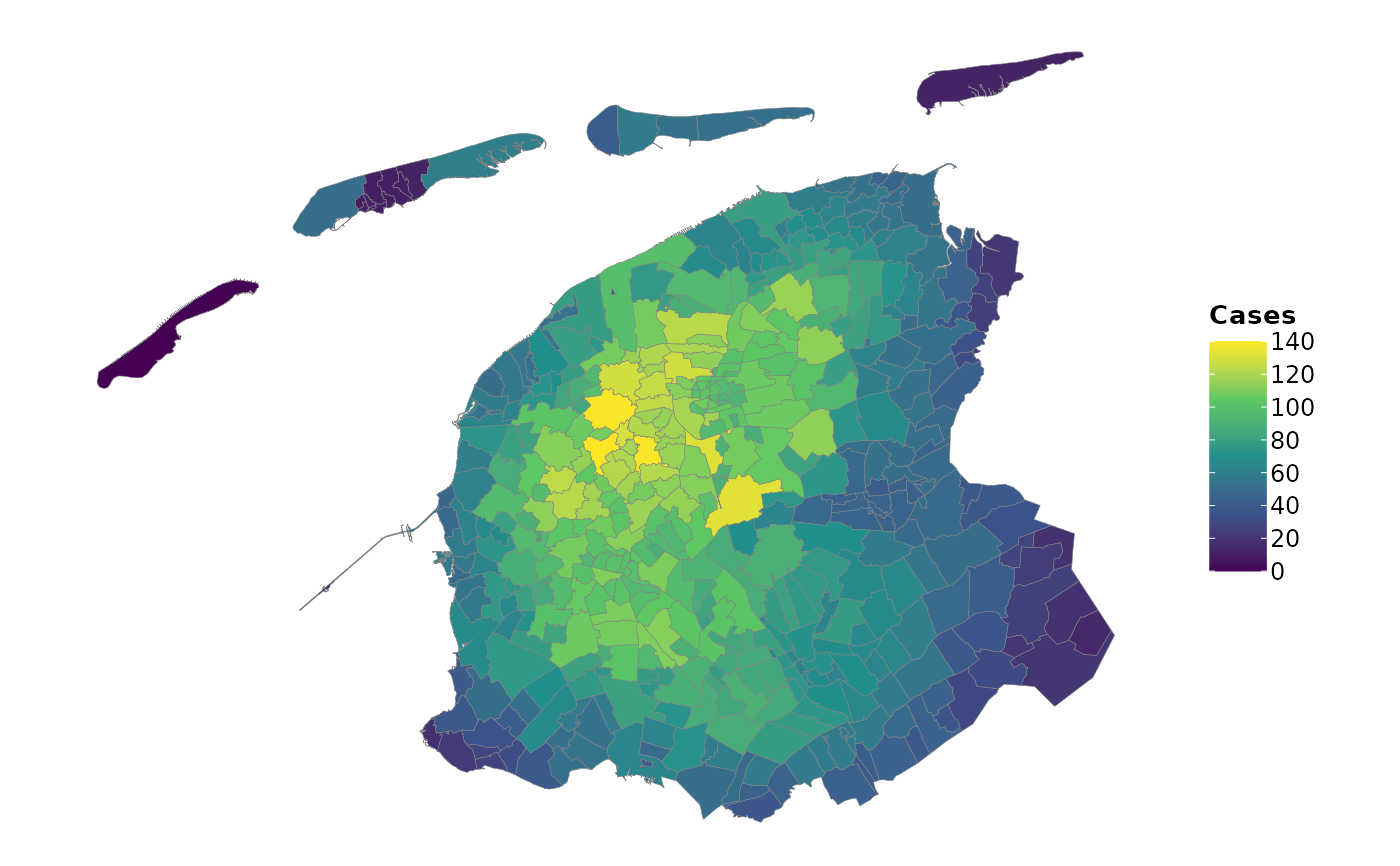
# plotting support:
if (require("certeplot2")) {

  radial_check |>
    add_map() |>
    filter_geolocation(provincie == "Friesland") |>
    plot2(category = cases_within_radius,
          category.title = "Cases",
          datalabels = FALSE,
          colour_fill = "viridis")

}
#> Joining, by postcode
